Anomaly Detection
Catch abnormal transaction volume before it costs you.
Cleo learns the normal behavior of every eligible partner and document flow, then automatically surfaces unusual spikes, silent drops, and longer-term trends—without thresholds to configure.
Walmart · 320 actual vs. 1,455 expected
Target · 2,156 actual vs. 890 expected
Amazon · 125 actual vs. 358 expected
See what changed—and where to start
Instead of scanning every dashboard, scorecard, and transaction flow, start with a prioritized view of the partner and document combinations behaving abnormally.
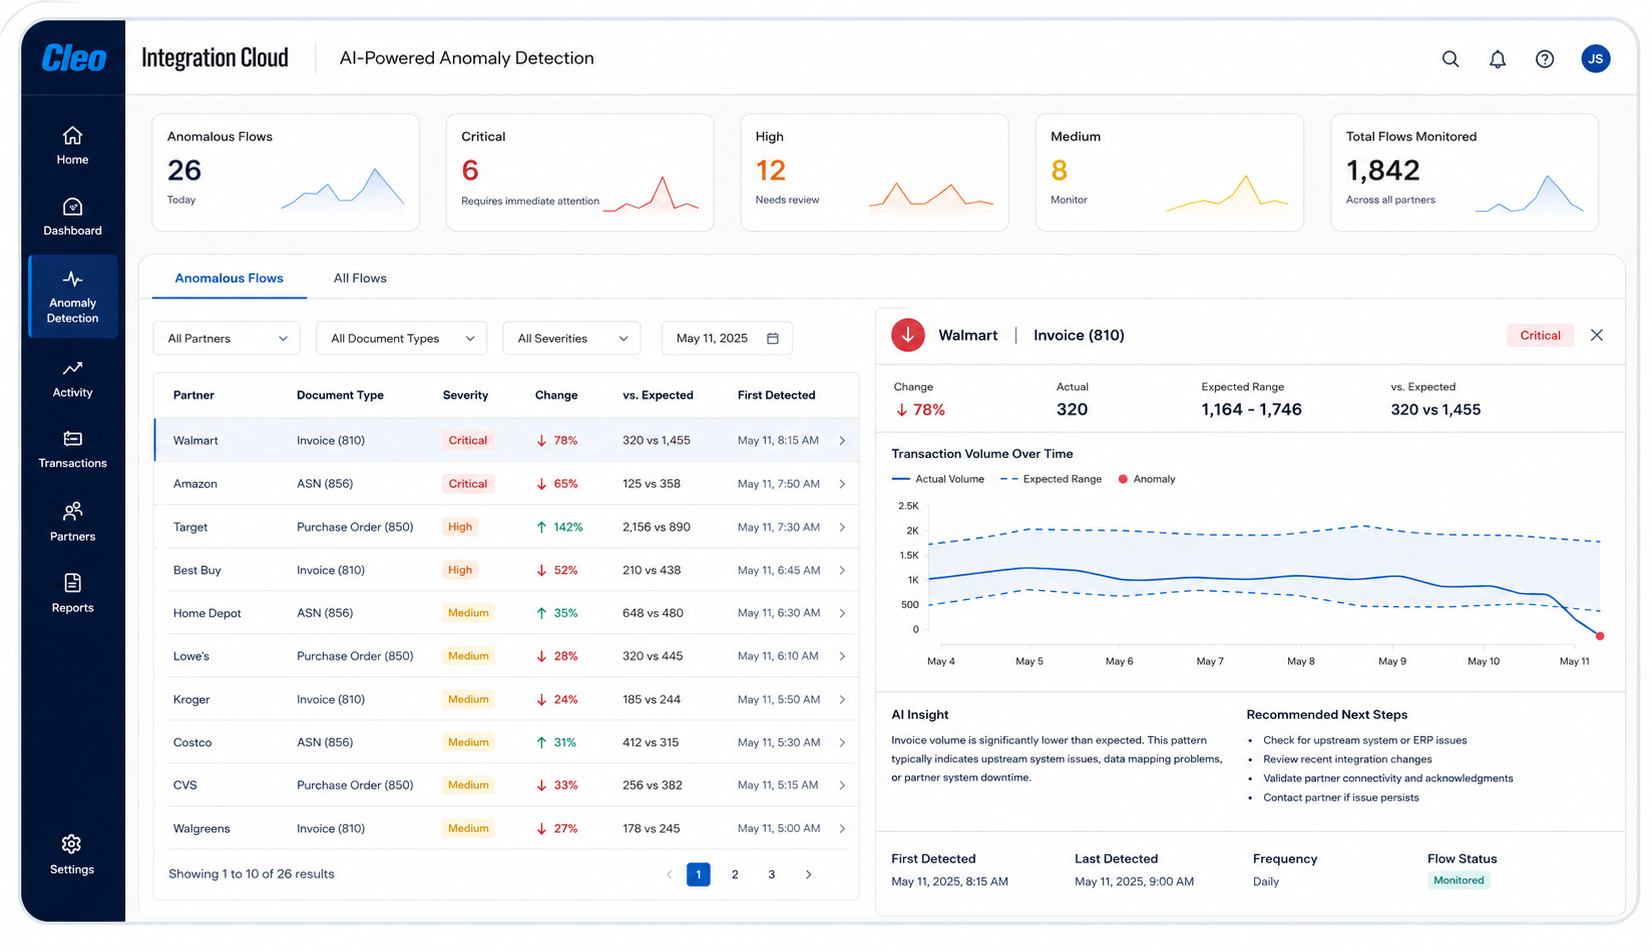
Find the needle without searching the whole haystack
Transaction-volume problems often stay silent until revenue reporting, retailer scorecards, customer escalations, or downstream disruption reveal them. Cleo brings the right flow to the top while there is still time to act.
Detect silent drops
Know when a key partner or document flow goes quiet compared with its own history.
Flag unusual spikes
Assess whether higher-than-expected activity reflects valid demand, duplicates, or process risk.
Reveal long-term trends
See gradual partner-volume changes across weeks or months—not only day-over-day movement.
Prioritize exceptions
Replace broad manual dashboard sweeps with a focused daily review queue.
Turn volume into an early health signal
A transaction count is more than activity. A meaningful change can be the first evidence of a revenue, fulfillment, procurement, compliance, or integration problem.
See meaningful drops or spikes the next morning
Surface unusual PO, ASN, invoice, acknowledgment, or API volume from a key partner the day after it occurs—instead of learning about it weeks later through a scorecard or fine.
- Catch a retailer PO shutoff before revenue reporting
- Flag an ASN surge before duplicates create chargebacks
- Identify an invoice drop before it becomes an AR gap
See the pattern behind a slow decline
Use historical analysis to surface a gradual downward trend across weeks or months that a day-over-day comparison alone can miss.
- Access up to a year of volume history
- Compare actual behavior with the learned expected range
- Bring evidence to partner conversations earlier
Review what needs attention first
Prioritize anomalous flows for daily review so teams are not manually scanning thousands of transactions to discover what changed.
- Start troubleshooting from a narrowed scope
- Review anomalies by partner and document type
- Build a daily review habit instead of firefighting
Learn. Detect. Surface.
AI-powered detection runs automatically across eligible transaction flows in Cleo Integration Cloud.
Build the expected range
Uses each partner and document-type combination’s historical volume behavior.Find the deviation
Flags spikes, drops, and changes that fall outside the learned expected pattern.Prioritize daily review
Delivers the prior day’s anomalies in a focused exception view the next morning.Understand why a flow was surfaced
Open an anomaly to review actual volume against the expected range and see the pattern that led up to it. Longer-range history helps teams distinguish a one-day event from a developing partner trend.
- Up to one year of transaction-volume history
- Actual volume compared with the expected range
- Partner, direction, and transaction-type filters
- A clear starting point for troubleshooting
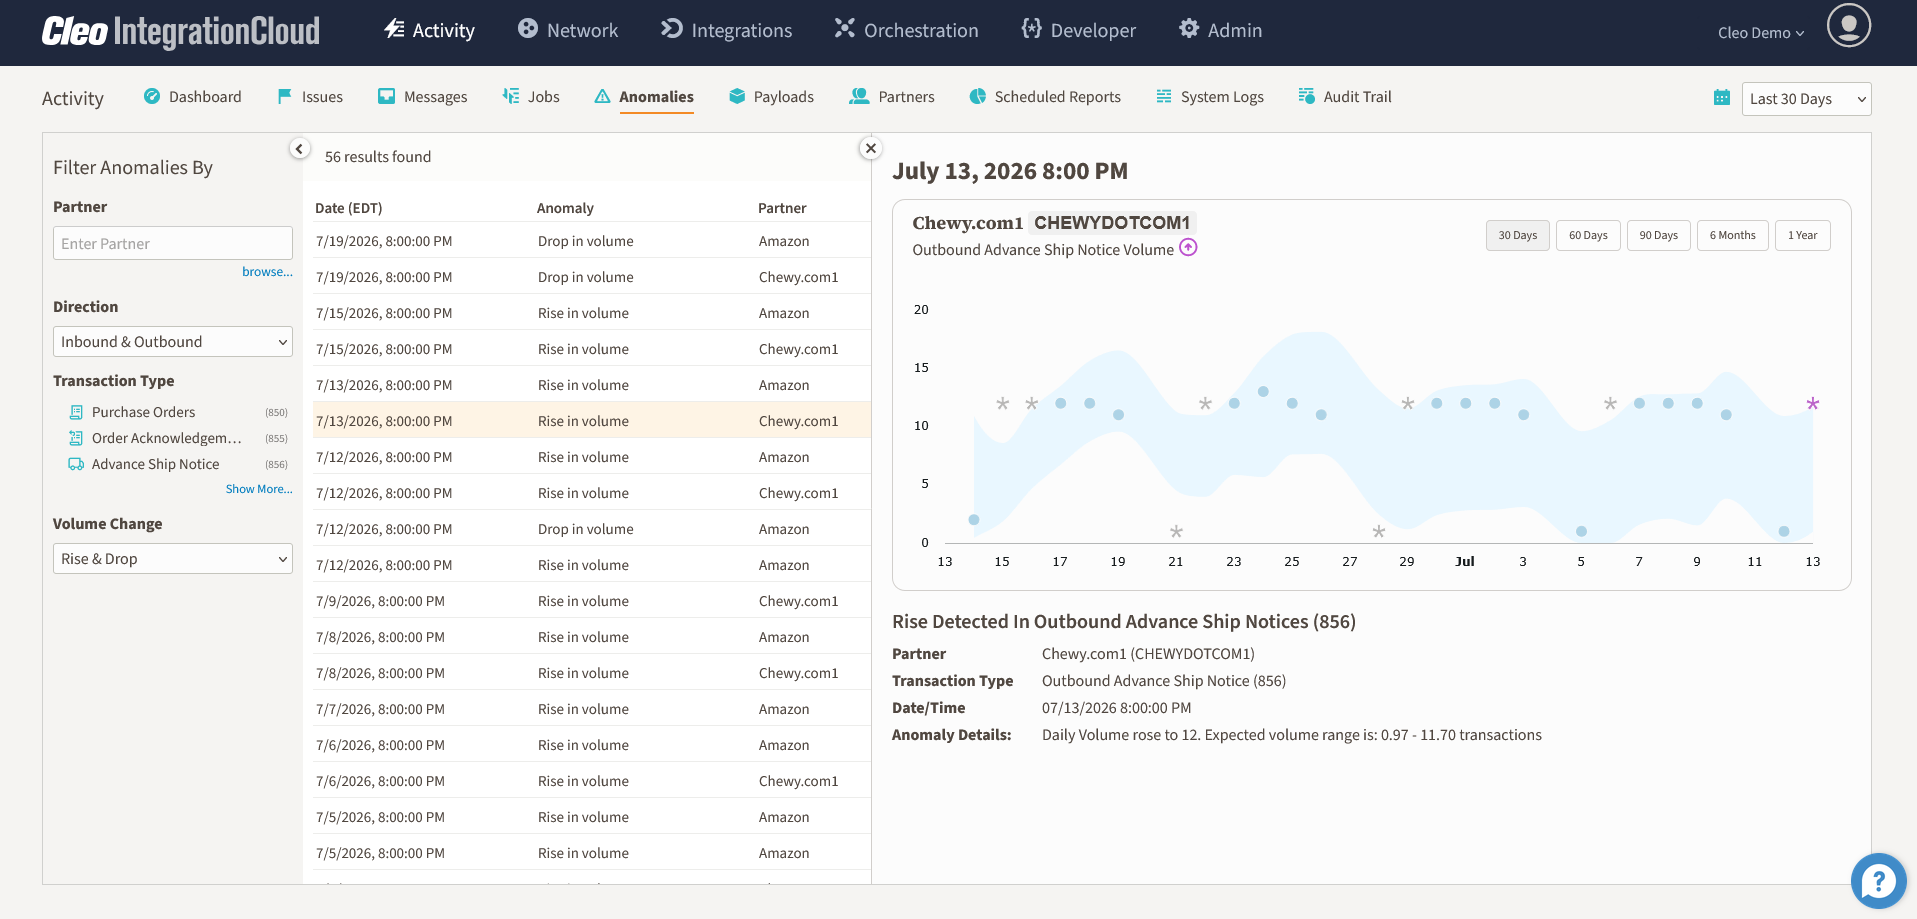
Watch AI-powered anomaly detection find what changed
See how Cleo turns partner and document-volume history into a prioritized daily view—giving teams a faster route from a silent change to a focused investigation.
If the embedded player is unavailable, watch the anomaly detection demo on Cleo.com.
Find volume problems while the recovery window is still open
The value is not another dashboard. It is earlier intervention, less manual investigation, and more time to prevent a small signal from becoming a larger penalty or revenue event.
One signal. Multiple business outcomes.
Cleo helps teams interpret volume as an operational health signal across the business.
Go deeper into visibility and intelligent operations
Anomaly Detection questions
What does AI-powered anomaly detection monitor?
It automatically monitors eligible transaction-volume behavior across trading partners, document types, APIs, and flows in Cleo Integration Cloud.
Do users have to configure thresholds or write rules?
No. It learns each eligible flow’s historical behavior and runs automatically, with no manual thresholds, tuning, or ongoing configuration to maintain.
How quickly are anomalies available?
The prior day’s unusual spikes and drops are surfaced the next morning in a prioritized daily view—rather than waiting for weekly or monthly scorecards.
How much history can users review?
Users can access up to a year of transaction-volume history alongside a flagged anomaly to see the full pattern leading up to it and understand why it was surfaced.
Is an anomaly proof that a business problem occurred?
No. It is a focused starting point for investigation. Cleo narrows thousands of transactions to the partner and document flow most likely to need attention, while the user determines the business cause and response.
Know what changed before the impact shows up.
See how Cleo can help your team monitor more flows, find abnormal volume earlier, and start every investigation from the right place.